It's my last day! But maybe not, Sam might have convinced me to come one more day to work on possible extraction?
Today was pretty simple, I worked on reflecting on the past couple of weeks and starting to form a project outline. Sam asked Grace and I to work on counting oysters again and we did that for the remaining time. Today we filled two blue tubes with 10 oysters each and a single tube with 500 oysters. After we put them in the tube we put 500 microliters in and used a blue pestle for homogenization, then we filled it with another 500 microliters! Fun stuff. I will miss everyone so much, as well as the time I've spent here.
August 12, 2014
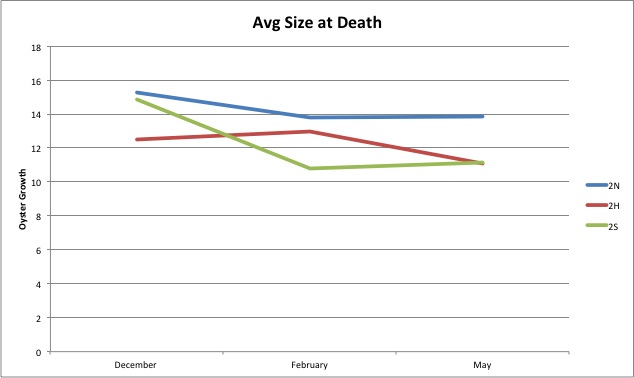
My time here is coming to a close; unfortunately tomorrow is my last day! I got a lot more morts to measure, but I finished them this morning. I also made the data into pie charts that I posted here:
https://docs.google.com/presentation/d/1DliUTN-7Ii4T-c_mZn2fcWUnQ8trDUcv7cXjgf5RJHE/edit?pli=1#slide=id.g39275c354_129
here are some samples:
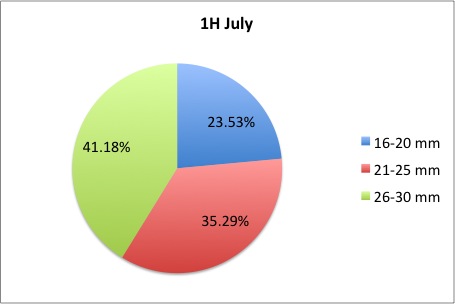
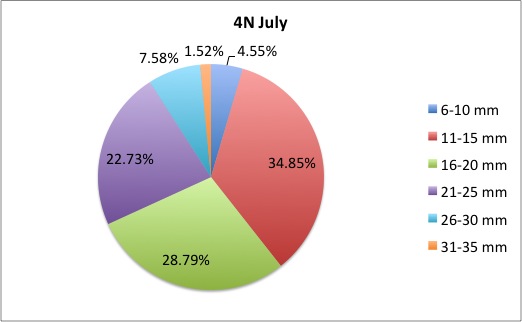
I loved working on these!
August 6, 2014
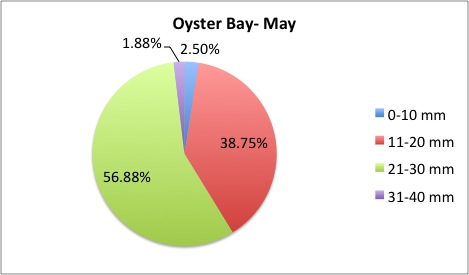
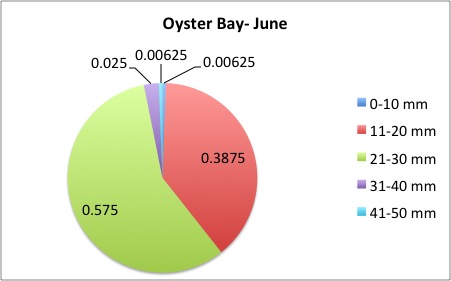
I finished the pie charts! All of the pie charts for each site and population are now available here:
https://docs.google.com/presentation/d/1DliUTN-7Ii4T-c_mZn2fcWUnQ8trDUcv7cXjgf5RJHE/edit?pli=1#slide=id.g39275c354_129
Here are a couple samples:
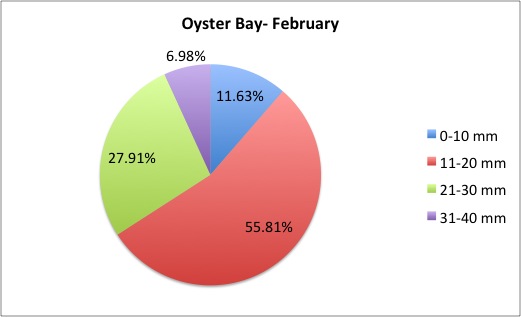
August 5, 2014
More of the same! I'm making lots of interesting graphs!
https://docs.google.com/presentation/d/1DliUTN-7Ii4T-c_mZn2fcWUnQ8trDUcv7cXjgf5RJHE/edit#slide=id.g39244aa04_04
It's very tedious to make these graphs because of how specific they are. First I take a row of data from a single tray and a specific site(e.g. 1N) and use the "countif" equation in google sheets to count how many oyster are in a specific range. An example of an equation would be =countif(D2:D48, "<6"). Google sheets thinks about it, then tells me how many of the cells are less than 6. The real issue is that I can't select a range between two numbers. The only way I've been able to do it is put in a second equation that's the next increment in the next cell like this: =countif(D2:D48, "<11"). After I get the second number I simply subtract the first number from it and that leaves how many were actually in 6-10 or 11-15 or any.
August 4, 2014
Today I got some clarification on what I needed to do with my pie charts and I got right to work. What I was doing was too general to compare anything; I found out that I needed to make 3 pie charts per site, like this:
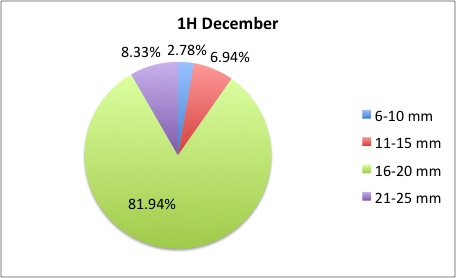
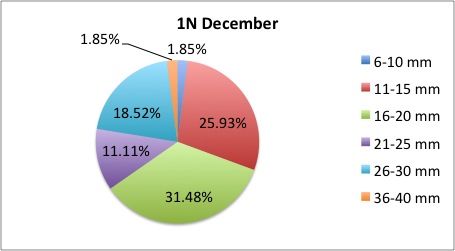
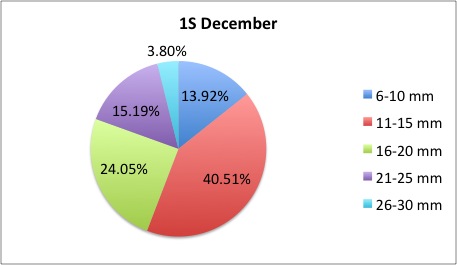 I also was told to make the increments in 5's.
The rest of my charts are available here:
https://docs.google.com/presentation/d/1DliUTN-7Ii4T-c_mZn2fcWUnQ8trDUcv7cXjgf5RJHE/edit#slide=id.g39244aa04_04
July 23, 2014
Today I completed the leftover pie charts I didn't finish yesterday. I will be looking at the blog and trying to making graphs of the data available. I will also be trying to figure out how to make the line graphs I made just points and not connected lines.
Heres another example of a pie chart I've made:

I think this chart is really interesting because the largest dead oyster yet was in it. It was one oyster and it was 41mm long!
July 22,2014
I have been working a lot on making graphs from the measurements I have made. I have made a couple basic line graphs, and I am currently working on pie charts showing what percent from each site grew within a certain bracket.

This is an example of a pie chart I've made.
July 16, 2014
Today I focused on making a ton of graphs covering the measurments I've taken. I made a bunch of line graphs that can be found here:
https://docs.google.com/presentation/d/1DliUTN-7Ii4T-c_mZn2fcWUnQ8trDUcv7cXjgf5RJHE/edit?usp=sharing
I also counted oyster larvae through a microscope. I counted each well three times.
| trial 1 |
trial 2 |
trial 3 |
|
| first well |
323 |
322 |
331 |
| second well |
264 |
272 |
260 |
| third well |
237 |
239 |
242 |
second avg: 265.333
third avg: 239.333
July 15, 2014
I got a couple more oysters to measure and instructions on how to make new graphs. I made one example/ template graph today.
I have also been working a little more in the Google Drive, so that is available here:
https://docs.google.com/spreadsheets/d/16GYj-hIJCdnLQnFyVbON2PZq5ii9uTEwo0gJH_deOX8/edit#gid=1823064962
July 14, 2014
Today I looked at the summary sheet of the data I have collected from the measurements of the oysters from the various beaches, and I tried to find the holes in my data. I found three bags of oysters not yet inputted and I measured those, this will help me create more complete graphs of the size of deaths over the couple of months.
July 9, 2014
I measured a gallon bag full of about 150 dead oyster shells from Oyster Bay. These were taken a day before the ones from Fidalgo, but they were significantly more wet, also much larger. I updated the summary I am making of the oyster mortalities. I am continuing to work on graphs and better organized versions of the data I have.
July 7, 2014
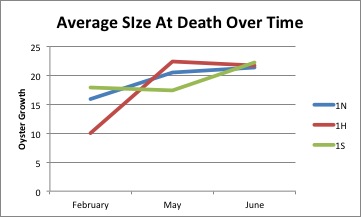
I have started the day trying to make more sense of the data I have created from the dead oyster shells. I have made two graphs and shared them with Jake via Google Drive, asking if they are okay and what I should improve on or change. I will probably continue to do this with the suggestions Jake gives. I am also looking for some background knowledge to gain on excel graphs.
| February-From Fidalgo .jpg |
| February Oyster Bay Graph.jpg |
I also measured another gallon bag of oysters from Fidalgo, I have to make a couple graphs of the data I have, I might do some of that at home on my laptop.
*I used copy and paste to transfer this notebook, so some of the format is probably a little weird.
July 1, 2014
Yesterday Grace and I organized boxes of oyster larvae and put them in lab 209 above the first sink on the right. We organized the tubes by date, we only had enough falcon tube containers for about 50 of the tubes, so around 15 are taped together and labeled with the date they were taken.
I got two more bags of oysters to measure, they were recorded and added on to my master file.
| Measured Dead Oysters 7114.xlsx |
Measured Dead Oysters 7114.xlsx
June 25, 2014
I worked on measuring the oysters Jake left for me. I completed measurement of the three bags of oysters from Fidalgo, Oyster Bay, and Manchester. Sent to Jake via email.
*I noticed that some of the bags of oysters had a different date written on them than what was printed inside the bag, I used the printed date.
| Measured 062514 Dead Oysters.xlsx |
Measured 062514 Dead Oysters.xlsx
When I measured the oysters I first took everything out of the ziplock bag, wrote the correct information on the excel spreadsheet (site, tray, mm, # of animal, and # of animals in bag. Average size of animals in bag and the standard deviation I recorded after I found all the lengths. After the preliminaries were recorded I started measuring the oysters, I began with the oysters that were a complete shell, I did the half shells later. After all the full shells were measured I looked at each half shell and compared them with each other, I wanted to see if any two half shells were complimentary with one another. If I found any half shells that were actually two parts of the same shell I would take the biggest measurement and not count the other, as Jake told me to do.
June 24, 2014
Today was spent measuring oysters and recording them in a spreadsheet. I also finished the master data sheet, I added the minimums maximums and averages for all of the separate trays.
I got a couple more bags of dead oyster samples to measure and record, but I didn't have enough time to complete them.
June 23, 2014
Back at the lab!
Olympic Oyster project
http://oystergen.es/olympia/
--> Looking for evidence of local adaptations.
- Ostrea edulis
- Ostrea Lurida
- Marine invertebrates
-Epigenetic
-Balanced Polymorphism
What levels of genetic variations are present among oyster populations (in Puget Sound Basin)
Project plan:
- Oyster transplants among different bays (Fidalgo, Dabob, Oyster Bays)
- Monitor growth: shell length, weight. Mortality: total census of living oysters. reproduction
- Subsample
- Characterize genetic & epigentic profiles
Looking at genomic differences to see if the differences in populations are truly genes or if they are predation or other causes.
Jake used HPF70 which keeps the shape of proteins functional.
Big questions:
Are the observed mortality rates caused by genomic or epigenomic differences?
Does the habitat affect reproductive success and select for genomic profiles most fit for the habitat?
Would transplants have any effect on native populations?
-Sequencing isn't in the picture right now, in the future though
Anesthetization reproduction meaning method:
Epson salt will make the oysters open up, allowing us to wash out the larvae
Larval traps are basically traps that allow salt water to flow in, the larvae float to the bottom where they die and just stick, later someone comes and counts that larvae.
What I actually did:
I looked at the master list of oyster lengths on an excel spreadsheet and did a couple of statistical things. I found the max and min for the three locations, as well as the average and standard deviation. I also found all the averages of the different trays, I am in the process off finding the appropriate min and max for each tray.
| Site |
Tray |
Averages |
Maximum |
Minimum |
Stdev |
|||
| Oyster Bay |
22.194 |
39.443 |
13.309 |
5.322 |
22.194 |
|||
| Fidalgo |
total |
19.245 |
35.897 |
7.157 |
5.155 |
19.245 |
||
| Fidalgo |
2S 5-8 |
22.328 |
6.040355513 |
3.94867501 |
15.04463614 |
|||
| Fidalgo |
2S 1-4 |
18.805 |
||||||
| Fidalgo |
2S 9-12 |
20.257 |
oyster bay |
22.19443261 |
||||
| Fidalgo |
2S 13-16 |
21.414 |
fidalgo |
19.76465968 |
||||
| Fidalgo |
2H 13-16 |
16.730 |
manchester |
19.76409397 |
||||
| Fidalgo |
2N 5-8 |
20.439 |
||||||
| Fidalgo |
2N 1-4 |
19.983 |
||||||
| Fidalgo |
2H 5-8 |
16.319 |
||||||
| Fidalgo |
2N 13-16 |
19.097 |
||||||
| Fidalgo |
2N 9-12 |
19.719 |
||||||
| Fidalgo |
2H 9-12 |
16.24475829 |
||||||
| Manchester |
total |
15.04463614 |
31.63881941 |
6.040355513 |
3.94867501 |
|||
| Manchester |
4S 5-8 |
15.92781144 |
||||||
| Manchester |
4S 9-12 |
14.54631922 |
||||||
| Manchester |
4N 13-16 |
15.3421702 |
||||||
| Manchester |
4H 5-8 |
14.75022455 |
||||||
| Manchester |
4N 5-8 |
16.7019488 |
||||||
| Manchester |
4S 1-4 |
15.69862766 |
||||||
| Manchester |
4H 13-16 |
12.35106946 |
||||||
| Manchester |
4H 1-4 |
14.30359922 |
||||||
| Manchester |
4N 9-12 |
16.17813827 |
||||||
| Manchester |
4S 13-16 |
14.90741717 |
||||||
| Manchester |
4N 1-4 |
15.86111094 |
||||||
| Manchester |
4H 13-16 |
14.22854153 |
June 25, 2013
DNAzol Protocol:
We retrieved the tissue sample from the freezer that held it at -80C`; we got DH6 and BB18. We then weighed each sample. DH6: 45mg and BB18: 23.5mg (We got to amount after trimming off extra parts) After that we put 500 µl DNAzol in with the tissue sample. We then squished the tissue with a pestle a while. Emma put in 500 µl more DNAzol to equal 1 ml. Then we added 2.35 µl of proteinase K. We turned it around a bit and placed it in a device that spins it. We're leaving it to spin for about an hour; we cleaned up our area and put things back in their respective places.
We put the DNA tissue on the centrifuge at at 1000 g for 10 minutes to sediment it. We heated the tubes to 55C to make the DNA more workable. After 10 minutes we took the DNA of the tubes and put them in separate tubes; we added .2µL of 100% ethanol and inverted 5 times. We left the DNA at room temperature for 3 minutes, after we put the tubes in the centrifuge for 5 minutes at 5000 g
Washing:
We took the liquid out of the tube using a pipette leaving on the pellet. We added 75% ethanol and inverted it a couple times (x2)
PCR: Denaturation -95C, annealing -55C, extension -72C (x40)
12.5 µL apex; 9.5µL H20; .5 µL each 10µLprimer; 2µL DNA
We let the DNA air out to get the ethanol residue off. We added 200 µL of water and heated it, after placing in the centrifuge.
Nanodrop:
First use water. Concentration 154.7nl/µL; 260/180=1.89
We first put apex and water into the wells
Ten 5µL of primer
lastly 2 µL of DNA.
the wells were spun up a bit.
June 27, 2013
Making 1% Agarose Gel
Ingredients:
agarose .5g
TAE 50 mL
ethidian bromide
We heated .5g of agarose in the microwave, after that we weighed it to know how much water to put in to compensate for evaporation.
We poured the agarose gel liquid in a contained that would make it a box shape with a comb in it for wells. After waiting 20 minutes for the gel to settle, and putting it in a box to conduct electricity through the DNA, we put the well mixtures that we made on June 25 into the gel wells. We mixed our DNA with a dye so that we could see it in the wells. After that we let the electric charge go through our gel.
After a while we put the gel under a black light to look at our results. The poor quality BB DNA didn't work as well as the DH DNA.
| photo.JPG |
DNA Extraction
Protocol:
First we added 48 ml of 100% ethanol to 12 ml buffer wash. We cut our sample size down to 10 g, and added to 800 µL of RNA buffer wash.
We centrifuged for 1 minute at 1200 g, then transfered the container and discarded the flow. We centrifuged it again for 30 seconds at 8 g. We added 320 µl of ethanol and mixed well ( also transfered into a different tube)
Centrifuged again for 30 seconds at 8 g
------Didn't make proper flow through-------
Retried centrifuge for longer time at higher g
-----Didn't yield proper flow through-------
Retried centrifuge for longer
Only control 2 yielded proper flow through.
We dumped the flow through out added 800 µL of RNA wash buffer in the collection tubes.
We transfered the tubes and centrifuged.
| Sample |
ng/µL |
260/280 |
| control 2 |
66.7 |
2.04 |
| control 3 |
55.9 |
2.07 |
| CU1 |
90.2 |
2.02 |
| CU2 |
137.3 |
2.02 |
Etilet, what was the bearing of the transect line we established (~Huperzia)?
June 28th, 2013
We went to our oyster location to take samples of 30 pacific oysters and 10 barnacles.
First we decided on a metal object jutting out of a tree to be our reference point because it looked like the only thing on the beach seemingly constant. We laid out our plot line. We did some quadrat work and it was mostly taken up by looking at barnacles and sand fleas.
| Shelton Beach Lab.jpg |
| SheltonBeachEtx.jpg |
Ahmed and I were given a quick tutorial on how to shuck oysters. Emma set up a little lab
July 2, 2013
In a separate lab than I'm used to we went in and got out a dissection microscope. I looked at various plankton for about a half hour. Nothing notable.
Ahmed and I went on the computer looking through sites for specific gene expressions that we wanted to focus on, we also looked for things like primers that were already designed for us.
Citations: Biochemical and Biophysical Research Communications, Volume 320, Issue 2, 23rd of July 2004;
Genes: HSP70 (Heat Shock); HSP90 (Heat Shock);
Primers:
What I actually decided to do:
On my own I began with a wide search on scholar.google.com; my search: "gene expression pacific oyster" . With this I scrolled through a number of links that were dead ends to me, because I either didn't have the knowledge to actually comprehend the very raw information, or I didn't have the interest. Among the blindingly dull incomprehensibly links I found this: Response of the Pacific oyster Crassostrea gigas to hypoxia exposure under experimental conditions.
I found this link incredibly interesting and relevant (mostly relevant, but that was more important) but I found myself still lacking in the proper know-how to understand the data. For a bit I played around looking through the page and google searching the various unknowns, without very much success. I directed my attention to the Discussion section of the page. After reading a bit Emma asked me how I was getting along in my research and I confessed my distress. With a few good pointers I was on my way!
The Important Stuff:
The genes I decided to focus on are:
CX069115
CX069169
CX069216
July 3, 2013
Today Maighread and Maddie joined Ahmed and I in our lab, we did some DNA extraction again but this time we didn't use the denoted kit that we had used before, we used chloroform and trireagent. Both the trireagent and the chloroform are very bad to breathe in so we did it under the hood.
We started out by cutting our tissue size to be 50-100 grams. Then we added 0.1 ml of chloroform and used the vortex to mix it all up. We let it sit for 2 minutes. Then we put it in a centrifuge for 15 at 12 g. We took the aqueous phase from the top of the tube into another tube and poured the nasty gunk out, and let it sit.
Then we centrifuged it again at the same speed and time.
At this time we washed the RNA pellet with 75% ethanol, and centrifuged it againf for 7,500 g for 5 minutes.
We let the pellet air dry for 5 minutes. We put water in the pellet and let it heat for a long time.
July 5, 2013
We started the day talking about PCR. We made a master mix of our PCR that included 125 µl of apex, 95 µl of water, and 5 µl of primers.
Then we made agarose gel, we made a bigger batch so we just multiplied our recipe like for the PCR. We used 1g of agarose, 100 ml of TAE, and some ethidian bromide.
Our Gel:
| gel 070513 annotated.jpeg |
Our PCR list:
DNAsed 2
" 4
" 5
" 7
RNA 2
" 4
" 5
" 7
Our nanodrop results of the DNAsed RNA were as follows:
2: 161, 4: 45.4, 5: 157, 7: 101.9
We had to add some RNA and water, depending on how much stuff there already was.
We then did something involving reverse transcriptase to get the complimentary code. We added 17.75 µl of RNA, 5µl of oligod, andd our primer; we heated that at 70C for 5 minutes.
Later we added 5µl of buffer, 1.25 µl of DNTP, and .5 of reverse transcriptase.
Research on the Hood Canal and my Gene:
The hood canal is a natural canal, and it has a volume off water that is about 21 cubic kilometers. It was created about 13,000 years ago. Captain George Vancouver named it the Hood canal after a man who was in the Royal navy, he used Hood's canal in his journals and maps and later it was decided to keep that as it's name. Algal blooms cause some parts of hood canal to be 'dead zones'. Meaning there is very low oxygen levels there. This is relevant to my project because my gene relates to hypoxia and the oysters reaction to areas of hypoxia. Hypoxia occurs more in the southern areas of Hood Canal. My hypothesis is that the gene CX069115 will be unregulated because that was the case in the experiment previously talked about. CX069169 will be down regulated. CX069216 will be unregulated.
July 8, 2013
Sygreen
Sygreen 10µL
F primer 0.8 µL
R primer 0.8µL
H2O 6.4µL
CDNA 2µL
Sso Fast
Sso Fast 10µL
F primer .5 µL
R primer µL
H2O 8µL
CDNA 1µL
----We needed to dilute the primers and the CDNA because they were too concentrated for our purposes. The primer we had 20 µL of primer to 180 µL of water. The CNDA was some number I didn't write down. After added the water we mixed it with the vortex and used the centrifuge.
Next we made a master mix for the QPCR. The sygreen master mix consisted of: Sygreen 66 µl
F primer 4.8
R primer 4.8
H2O 44
We mixed them up in the vortex and spun it in the centrifuge. Next we put it the wells, mixed and spun.
QPCR Protocol list:
1) Incubate at 95C for 2 minutes
2) Incubate at 95C for 5 seconds
3) Incubate at 60C for 25 seconds
4) Plate Read
5) Goto line 2 for 39 times
6) Melting curve from 75C to 95C read every 2C hold 10 seconds
----------END------------
My New Gene
- Gluthathinone peroxidase
- MYC
We can learn that when there's a lot of gluthathione peroxidase the organism is probably under some sort of oxidative stress.
We followed the same protocol for extracting RNA but this time we used samples: 1,3,6,8,9,10,21,22
July 10, 2013
We took a fairy ride out to Big Beef Creek. The conditions were muddy and partly cloudy. The beach went out very far and kept going out. We collected 20 oysters and 10 barnacles but one barnacle was discarded because it was left in the warm box.
July 15, 2013
We began with a lab meeting; then we decided we wanted to get started with RNA isolation on samples 31- 40 that we got from Big Beef Creek. We accidentally put wrong measurements into samples 31 and 32 so we'll have to do those again tomorrow.
We worked on Excel putting data from each beach into tables. We haven't done any real analysis of the data yet because of our slowness on Excel. We also need to put the scientific names into the tables. We haven't really gotten much done with Excel.
We followed the same protocol for RNA isolation, after we followed protocol for DNAsing. We made a few mistakes that force us to do two samples over again.
July 17, 2013
Today we wanted to finish the remaining oysters from Big Beef creek, so we began with RNA isolation of oysters 41-50, then we went through and DNAsed those oysters. We finished entering the oyster dimensions data in Excel and we started making some graphs about the data. We learned that possibly the oysters at Big Beef creek were smaller but that's probably just regular oyster variance in size.
July 18, 2013
Today we decided to work on our PCR with just 18s as our primer and we just used Sygreen, I'm not really sure why. We first made a sheet of the wells and where they would go. We started with 1 and wrote left to right by rows, not columns, we ended at 50, and then one more as our 18s negative. Sygreen for one is 10 µl Sygreen. .8µl F primer, .8 µl R primer, 7.4 µl H2O. We took all those measurements and multiplied them by 43 because we had 20 oysters from South Hood Canal and 20 from Big Beef Creek, 1 negative, and 2 extra to be safe. We had to dilute the DNAsed RNA because it didn't need to be so concentrated and it is good for detecting GDNA.
July 22, 2013
We started today with a lab meeting, I'm not too informed about what we're doing and that became apparent to everyone there.
Then we started lab work with doing the nano drop and writing down the concentrations of all of the DNAsed RNA except for 2,4,5, and 7 because we've already reverse transcribed them. Then we put the appropriate amount of RNA and water into the wells. I accidentally put 12 µL of extra water into well #32. We heated the plate for 5 minutes.
We made a master mix of Reverse Transcriptase that consisted of 5µL of Buffer, 1.25 of DNTP, and .5 of Reverse transtriptase. We had 36 samples so we multiplied those numbers by 38. Then we put 6.75µL into each well with the RNA and water and now we're heating it for an hour.
After lunch we made a master mix to test our primers. We are doing a PCR and we are making an agarose gel.
July 23, 2013
This is the result from our primer testing yesterday. The myc and HSP90 worked fine, but the cyp1a1 didn't work, and neither did the gpx
| Primer testing.jpg |
We made the agarose gel and put the gpx and the cypy1a1 in the Pcr machine.
We though that cyp1a1 had some primer dimer and gpx was a little funky, but we tested it on the QPRC anyway.
We diluted our Cdna 1:10 and we did qPCR on all of the samples with HSP90
July 24, 2013
We went to Debob bay (which is a public beach), when we got there the first thing we noticed was that this beach was significantly shorter than the other two beaches we sampled from, and the biodiversity was noticeably smaller. We recorded our data instead of on data sheets in notebooks because we left the data sheets in the lab. We had a few complications at this beach that we didn't really encounter at the other two beaches. One complication was that there were not as many organisms as the other two beaches, and the other complication was that they were not that many oysters. It took us an hour to find 9. Most of the oysters on the beach were just shells, and they were pretty convincing, but not helpful. A couple of times people came up and talked to us on the beach, but they didn't really disrupt the work day. We collected samples 62-69
July 29, 13
Today I started with putting in the data from Point Whitney, I made excel sheets for the biodiversity (all the graphs and figures) and the oyster sizes. While I did this Ahmed was doing the RNA isolation for the 8 samples we collected on Wednesday. We are at the moment doing some DNAsing, and then we'll set up reverse transcription.
July 31, 13
Today we started with a qPCR, we used CYP1A1 and EF1a, first we had to dilute the cyp1a1, and then we made master mixes. We put the CDNA into the qPCR machine, and now it's running.
We then mainly worked on our ppt and got a lot of work done.
